Oracle Core Dump Grapher
Anyone who has ever spent any significant amount of time working with an Oracle database has probably seen a ORA-600 or ORA-07445 “exception encountered: core dump” trace file.
Unfortunately, when you come across an Oracle core dump you can’t do much more than send the dump to Oracle and hope the issue is already resolved in a newer version, or that a patch is available for your current version.
This process usually consists of three steps:
- Collect the trace files related to the issue.
- Open a Service Request on Oracle’s Metalink site.
- Wait for a response
If you’re lucky, the first step is an easy one.
If you’re lucky you caught the first occurrence of the core dump and only need to shoot off a single trace file to the guys at Oracle.
On the other hand, if you’re not lucky, you might be handed 50-60 trace files spanning multiple weeks and be asked to sort them by distinct issue for reporting to Oracle.
I’m not lucky.
Sorting the trace files is a long process which involves searching the trace file for the dump, researching the issue on Metalink, finding similar issues on Metalink, and then sorting the trace files by those issues.
Two trace files into the process I knew there had to be a better way. Well, what better way to organize trace files than by the stack trace that generated the dump?
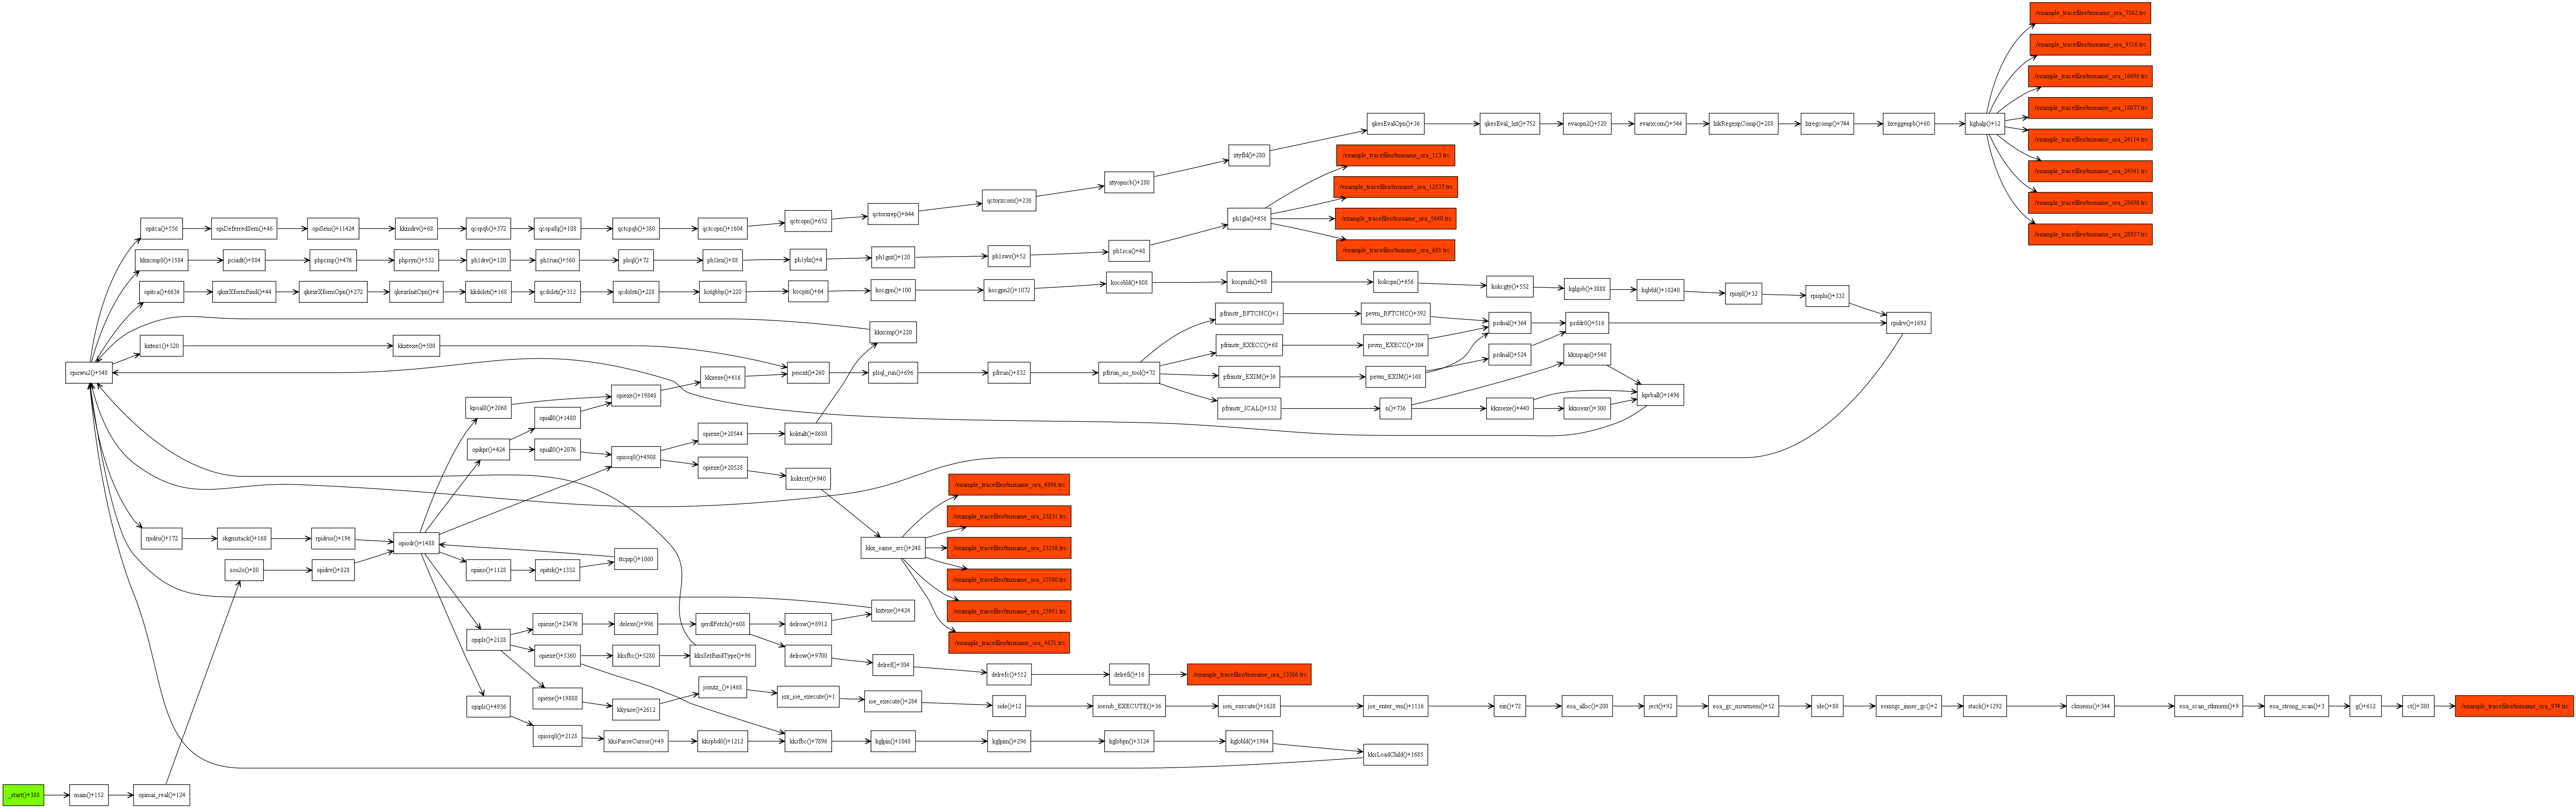
From that idea TraceFileGrapher was born. The TraceFileGrapher takes as input a directory of trace files, and creates a graph representing the call stacks of all of the trace files resulting in core dumps. The graph is then saved as any Graphviz compatible format of your choosing.
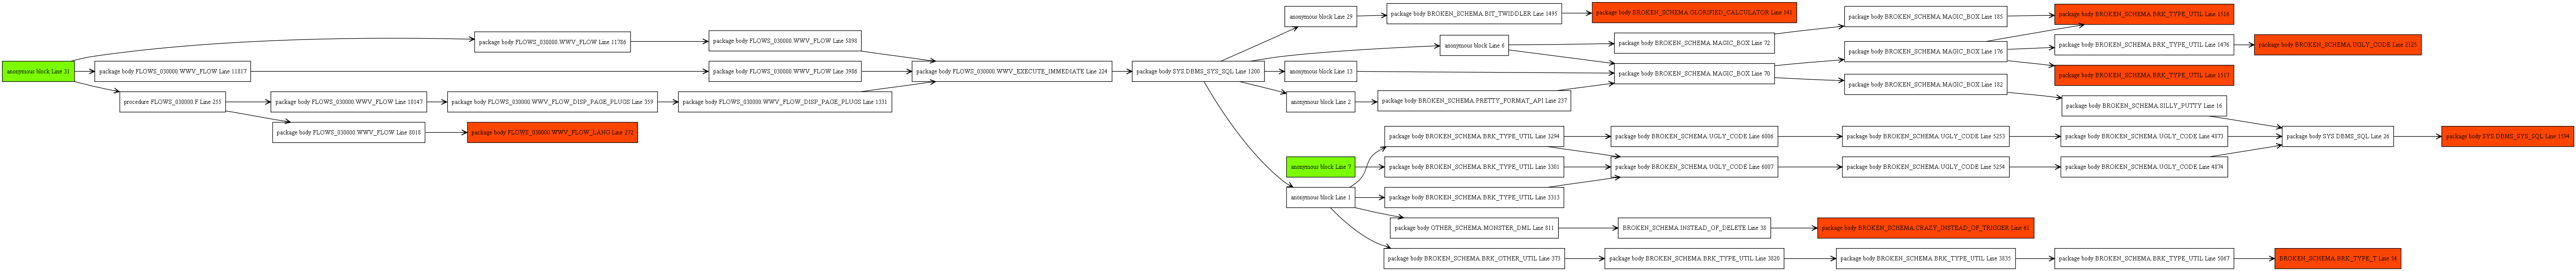
The graphs themselves are simple. The starting nodes of the graph are colored green. The ending nodes are colored red. For a stack trace graph, the end nodes are the names of the trace files in which the core dump appeared. For a PL/SQL Call stack graph, the end nodes are the final PL/SQL function or procedure call name.
Example Graphs
- Oracle Core Dump Stack Graph
- Oracle Core Dump Stack Graph without loops
- PL/SQL Call Stack Graph
- PL/SQL Call Stack Graph without loops
In addition to graphing core dump stack traces, TraceFileGrapher can graph PL/SQL Call Stacks as well.
The TraceFileGrapher requires Perl, the Graph::Easy Perl module, and the Graphviz open source graph visualization software.
Get the TraceFileGrapher here.